SNAP 2026 Score vs Percentile: Why Old Score Tables May Mislead You
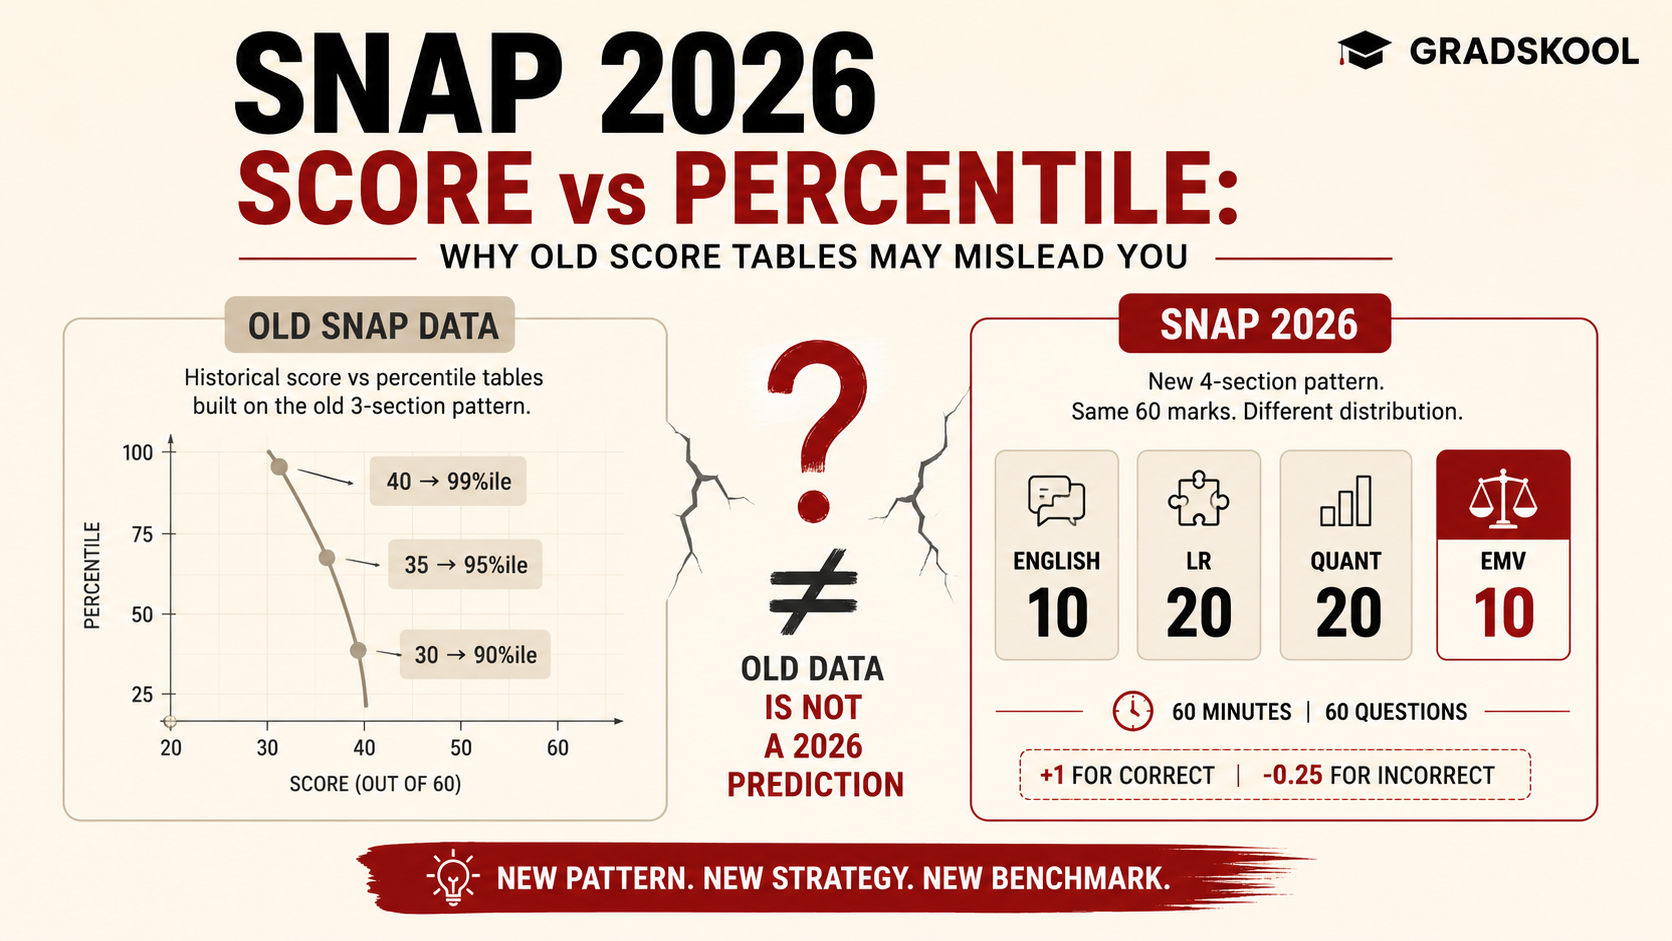
If you've searched for SNAP 2026 score vs percentile, you've probably already seen the tables.
40 marks = X percentile. 35 marks = Y percentile. 30 marks = Z percentile.
There's just one problem.
SNAP 2026 is a different exam from the one those historical tables were built around.
The total is still 60 marks. The test is still 60 minutes.
But the internal structure has changed, with Ethics, Morality & Values (EMV) becoming a new 10-question section.
That means historical SNAP score-vs-percentile data is still useful as context, but it should not be treated as a precise prediction for 2026.
Here's what the old data can actually tell you, what it can't, and how to use it while preparing for SNAP 2026.
Score vs Percentile: What's the Difference?
Your SNAP score is the number of marks you earn in the examination.
Your percentile tells you how your performance compares with the broader pool of candidates.
These are two different things.
For example, if you answer 40 questions, get 30 correct and 10 incorrect:
Score = (30 × 1) − (10 × 0.25) = 27.5
That's your raw score. Your percentile is a measure of where that performance places you relative to other candidates that same session.
This is why a score-vs-percentile table can never be interpreted in isolation. The same raw score can mean something different depending on the overall performance distribution in that year's exam.
SNAP 2026: The Official Exam Structure
Before looking at historical numbers, it's worth establishing what we're actually preparing for.
The official SNAP Test website lists the 2026 structure as:
Section | Questions | Marks |
|---|---|---|
General English | 10 | 10 |
Analytical & Logical Reasoning | 20 | 20 |
Quantitative, Data Interpretation & Data Sufficiency | 20 | 20 |
Ethics, Morality & Values | 10 | 10 |
Total | 60 | 60 |
The test duration is 60 minutes. Each correct answer earns 1 mark, each incorrect answer costs 0.25 marks, and candidates can attempt the sections in any order.
So the basic equation for SNAP 2026 is 60 questions, 60 marks, 60 minutes. But unlike previous SNAP patterns, those 60 marks are now distributed across four sections instead of three, and that changes the preparation equation.
What Happens If You Take SNAP More Than Once?
Another reason to be careful with old score-vs-percentile discussions.
SNAP 2026 allows candidates to appear for up to three tests. If you take more than one, your highest score is considered for the final percentile calculation. There is no score normalisation across attempts.
So your strategy can genuinely be SNAP 01, then SNAP 02, then SNAP 03, with your best score being the one that counts. SIU also states that the three papers are designed to maintain comparable difficulty and a normal spread across sections.
That makes one thing especially important. Don't judge your SNAP preparation from one mock or one test attempt alone. Look at the trend.
What Historical SNAP Data Can Still Tell You
Historical score-vs-percentile data isn't useless, it's just being asked to do a job it can't fully do anymore. Here's what real SNAP 2025 scorecards showed, based on actual candidate data across both test sessions.
Percentile | Approximate Score Range (out of 60) |
|---|---|
99+ | 36–48 |
98+ | 36–43 |
97+ | 26–39 |
96+ | 35–38 |
90+ | 30–34 |
85–90 | 35–39 |
75–85 | 30–34 |
Notice how much these ranges overlap and shift between sessions, one candidate scored 41.5 marks for 99.96 percentile in Test 1, while a similar percentile in Test 2 came from just 39.5 marks. Difficulty varies session to session, and percentile adjusts for it.
Institute cutoffs from recent years give a similar rough picture:
Institute | Approximate General Category Cutoff |
|---|---|
SIBM Pune | 98–98.5 percentile |
SCMHRD Pune | 96–97 percentile |
SIBM Bengaluru | 90–92 percentile |
SIIB Pune | 90–96 percentile |
SIBM Nagpur | 90–97 percentile |
Other SIU institutes | 50–88 percentile, varies widely |
Treat both of these tables as "this is what happened in a previous SNAP cycle," not "this score will produce the same percentile in SNAP 2026." Category-wise cutoffs (SC, ST, OBC, PwD) also run significantly lower than General category, sometimes by 30-40 percentile points, and vary by institute.
Why You Shouldn't Treat an Old Score Table as a 2026 Prediction
Previous SNAP papers had a different section-wise distribution. SNAP 2026 now has 10 General English, 20 Analytical & Logical Reasoning, 20 Quant/DI/DS, and 10 Ethics, Morality & Values. So although the total remains 60 marks, the composition of those 60 marks has changed.
That matters because students don't earn their total scores randomly, they earn them through different sections. A candidate who was historically strong in English now has fewer English questions available. A candidate who relied heavily on LR now has fewer LR questions relative to the whole paper. And everyone now has a new 10-mark section with zero historical precedent.
There are no previous SNAP EMV papers, no historical EMV score distribution, no established EMV difficulty trend, and no previous EMV score-vs-percentile relationship. So if you see a page today claiming "SNAP 2026 Score vs Percentile: 42 marks = 99 percentile," the honest question to ask is, where did that 2026 percentile data actually come from? The exam hasn't happened yet. There is no real 2026 score distribution to calculate from. At this stage, such numbers are necessarily estimates, and most of them are old tables with the year changed.
So What Should You Actually Target?
This is where students often get trapped, asking "how many marks do I need for 99 percentile?"
The honest answer right now is nobody knows, not because SNAP is unpredictable, but because SNAP 2026 hasn't happened yet. Use historical performance as rough context, the tables above included, but don't turn a historical number into a fixed target.
Instead, think in terms of two separate goals.
Target the percentile you need. If you're aiming for a particular Symbiosis institute, understand its recent cutoff range and treat that as your real target, not a specific raw score.
Build a score that's consistently competitive on the new pattern. This is where mocks matter. If you're consistently performing strongly across 10 English, 20 LR, 20 Quant/DI/DS, and 10 EMV, under the real 60-minute, negative-marking conditions, you're getting far more useful information than any old score table can give you.
Don't Confuse Percentile With Admission
There's another distinction students often miss. A high SNAP percentile doesn't automatically mean admission. Further admission processes are conducted separately by participating institutes, with programme-specific cutoffs set independently.
So there are three different things to track. Your score, how many marks you earned out of 60. Your percentile, how your performance ranks against the candidate pool. Your shortlist, whether a specific institute considers your percentile sufficient for its next stage. These are related, but they are not the same thing.
How to Actually Use Historical Score Data
Don't do this: "Last year 40 marks was around 95 percentile, so I need exactly 40."
Do this instead: "Historically, high percentiles have required strong, consistent raw scores across all sections. I'll use that as rough context while building my performance on the actual 2026 pattern."
Your mock scores should become increasingly informative as your preparation progresses. Track your score, accuracy, attempts, section-wise performance, EMV performance specifically, time spent per section, questions left unanswered, avoidable errors, and questions you should have skipped instead of attempted.
A single score tells you where you were. A sequence of analysed scores tells you whether you're improving.
The New Pattern Makes Mock Selection More Important
This is probably the biggest practical implication of everything above.
If your mock is still built on the old structure, 15 English, 25 LR, 20 Quant, you're practising for an exam that no longer matches the official 2026 pattern. Your full-length mock should instead reflect 10 English, 20 LR, 20 Quant/DI/DS, and 10 EMV, across 60 questions, 60 minutes, +1 / −0.25 marking, with flexible section order. That's the actual environment you need to build your score in.
Track Your Own 2026 Benchmark
Until a real SNAP 2026 score distribution exists, the most useful benchmark you can build is your own.
Take a realistic mock. Record your score. Analyse it. Fix the weaknesses. Take another. Compare.
Mock | Score | Accuracy | EMV | Major Weakness |
|---|---|---|---|---|
1 | 32 | 78% | 4/10 | LR |
2 | 35 | 82% | 6/10 | Quant |
3 | 38 | 86% | 7/10 | Time management |
4 | 41 | 89% | 8/10 | None significant |
That trend tells you something an old score-vs-percentile table cannot. You're getting better on the paper you're actually going to take.
Take a Free SNAP 2026 Mock
This is exactly why we built the GRADSKOOL SNAP 2026 Mock Test Series around the new four-section structure. The complete series contains 60 area-wise tests, 12 sectional tests, and 20 full-length mocks, 92 tests in total.
The first mock is free. Take it under the actual 60-minute structure, analyse your section-wise performance, and see where you actually stand.
The complete 92-test series is ₹1,499. If you're also preparing for NMAT, the combined bundle is ₹2,499 instead of ₹2,998 separately.
The Bottom Line
There is no genuine SNAP 2026 score-vs-percentile table yet, and that's not a problem, it just means you need to understand what historical data can and can't tell you.
Previous SNAP score distributions provide real context. They show you how competitive the exam has historically been, and roughly what territory strong percentiles have occupied. But they cannot give you a guaranteed 2026 conversion, because the examination structure itself has changed.
SNAP 2026 has four sections. 10 English. 20 LR. 20 Quant/DI/DS. 10 EMV. 60 questions, 60 minutes. The official SNAP Test website is the right place to verify the current structure and rules directly.
So don't spend your preparation trying to hit an old number from an old table. Prepare for the new paper. Build your own benchmark. And when the actual 2026 score distribution arrives, that's when we'll know what the new numbers really mean, we'll update this page the moment they do.
What is the difference between SNAP score and SNAP percentile?
Your score is the raw marks you earn out of 60. Your percentile shows how that score ranks against everyone else who took your specific SNAP session. Percentile, not raw score, determines your shortlist eligibility.
Can I trust SNAP 2025 score-vs-percentile tables for SNAP 2026?
Only as rough context, not as a prediction. SNAP 2026's internal structure has changed, English dropped from 15 to 10 questions and a new 10-mark EMV section was added, so the same raw score may not translate to the same percentile.
What percentile do I need for SIBM Pune or SCMHRD?
Based on recent years, SIBM Pune's General category cutoff has been around 98-98.5 percentile, and SCMHRD Pune around 96-97 percentile. These are directional estimates, official cutoffs are released only after each cycle's results.
Does taking SNAP multiple times hurt my score?
No. SNAP allows up to 3 attempts, and your highest score is used for the final percentile, with no normalisation applied across attempts.
Is there an official SNAP 2026 score-vs-percentile table available yet?
No. That data can only exist after the exam is conducted and results are announced. Any table claiming to show exact SNAP 2026 conversions this far in advance is an estimate at best.
How can I know where I actually stand for SNAP 2026?
Take full-length mocks built specifically on the new 4-section pattern, and track your score, accuracy, and section-wise performance over multiple attempts rather than relying on old percentile tables.
Related SNAP 2026 Guides
SNAP 2026 Exam Pattern: Complete 4-Section Breakdown →
SNAP 2026 Ethics, Morality & Values: New EMV Section Decoded →
SNAP 2026 Mock Test Series: 92 Tests Built for the New Pattern →